Hi,
I am writing a paper about Australia’s monetary system and I wish to include circular flow diagrams to help explain to the reader how money (payments) flows through the economy. I have looked through lots of SD papers, how to guides and other resources but have not found a software that does what I want. Can anyone please suggest something? For this paper I am not looking to create causal loop diagrams.
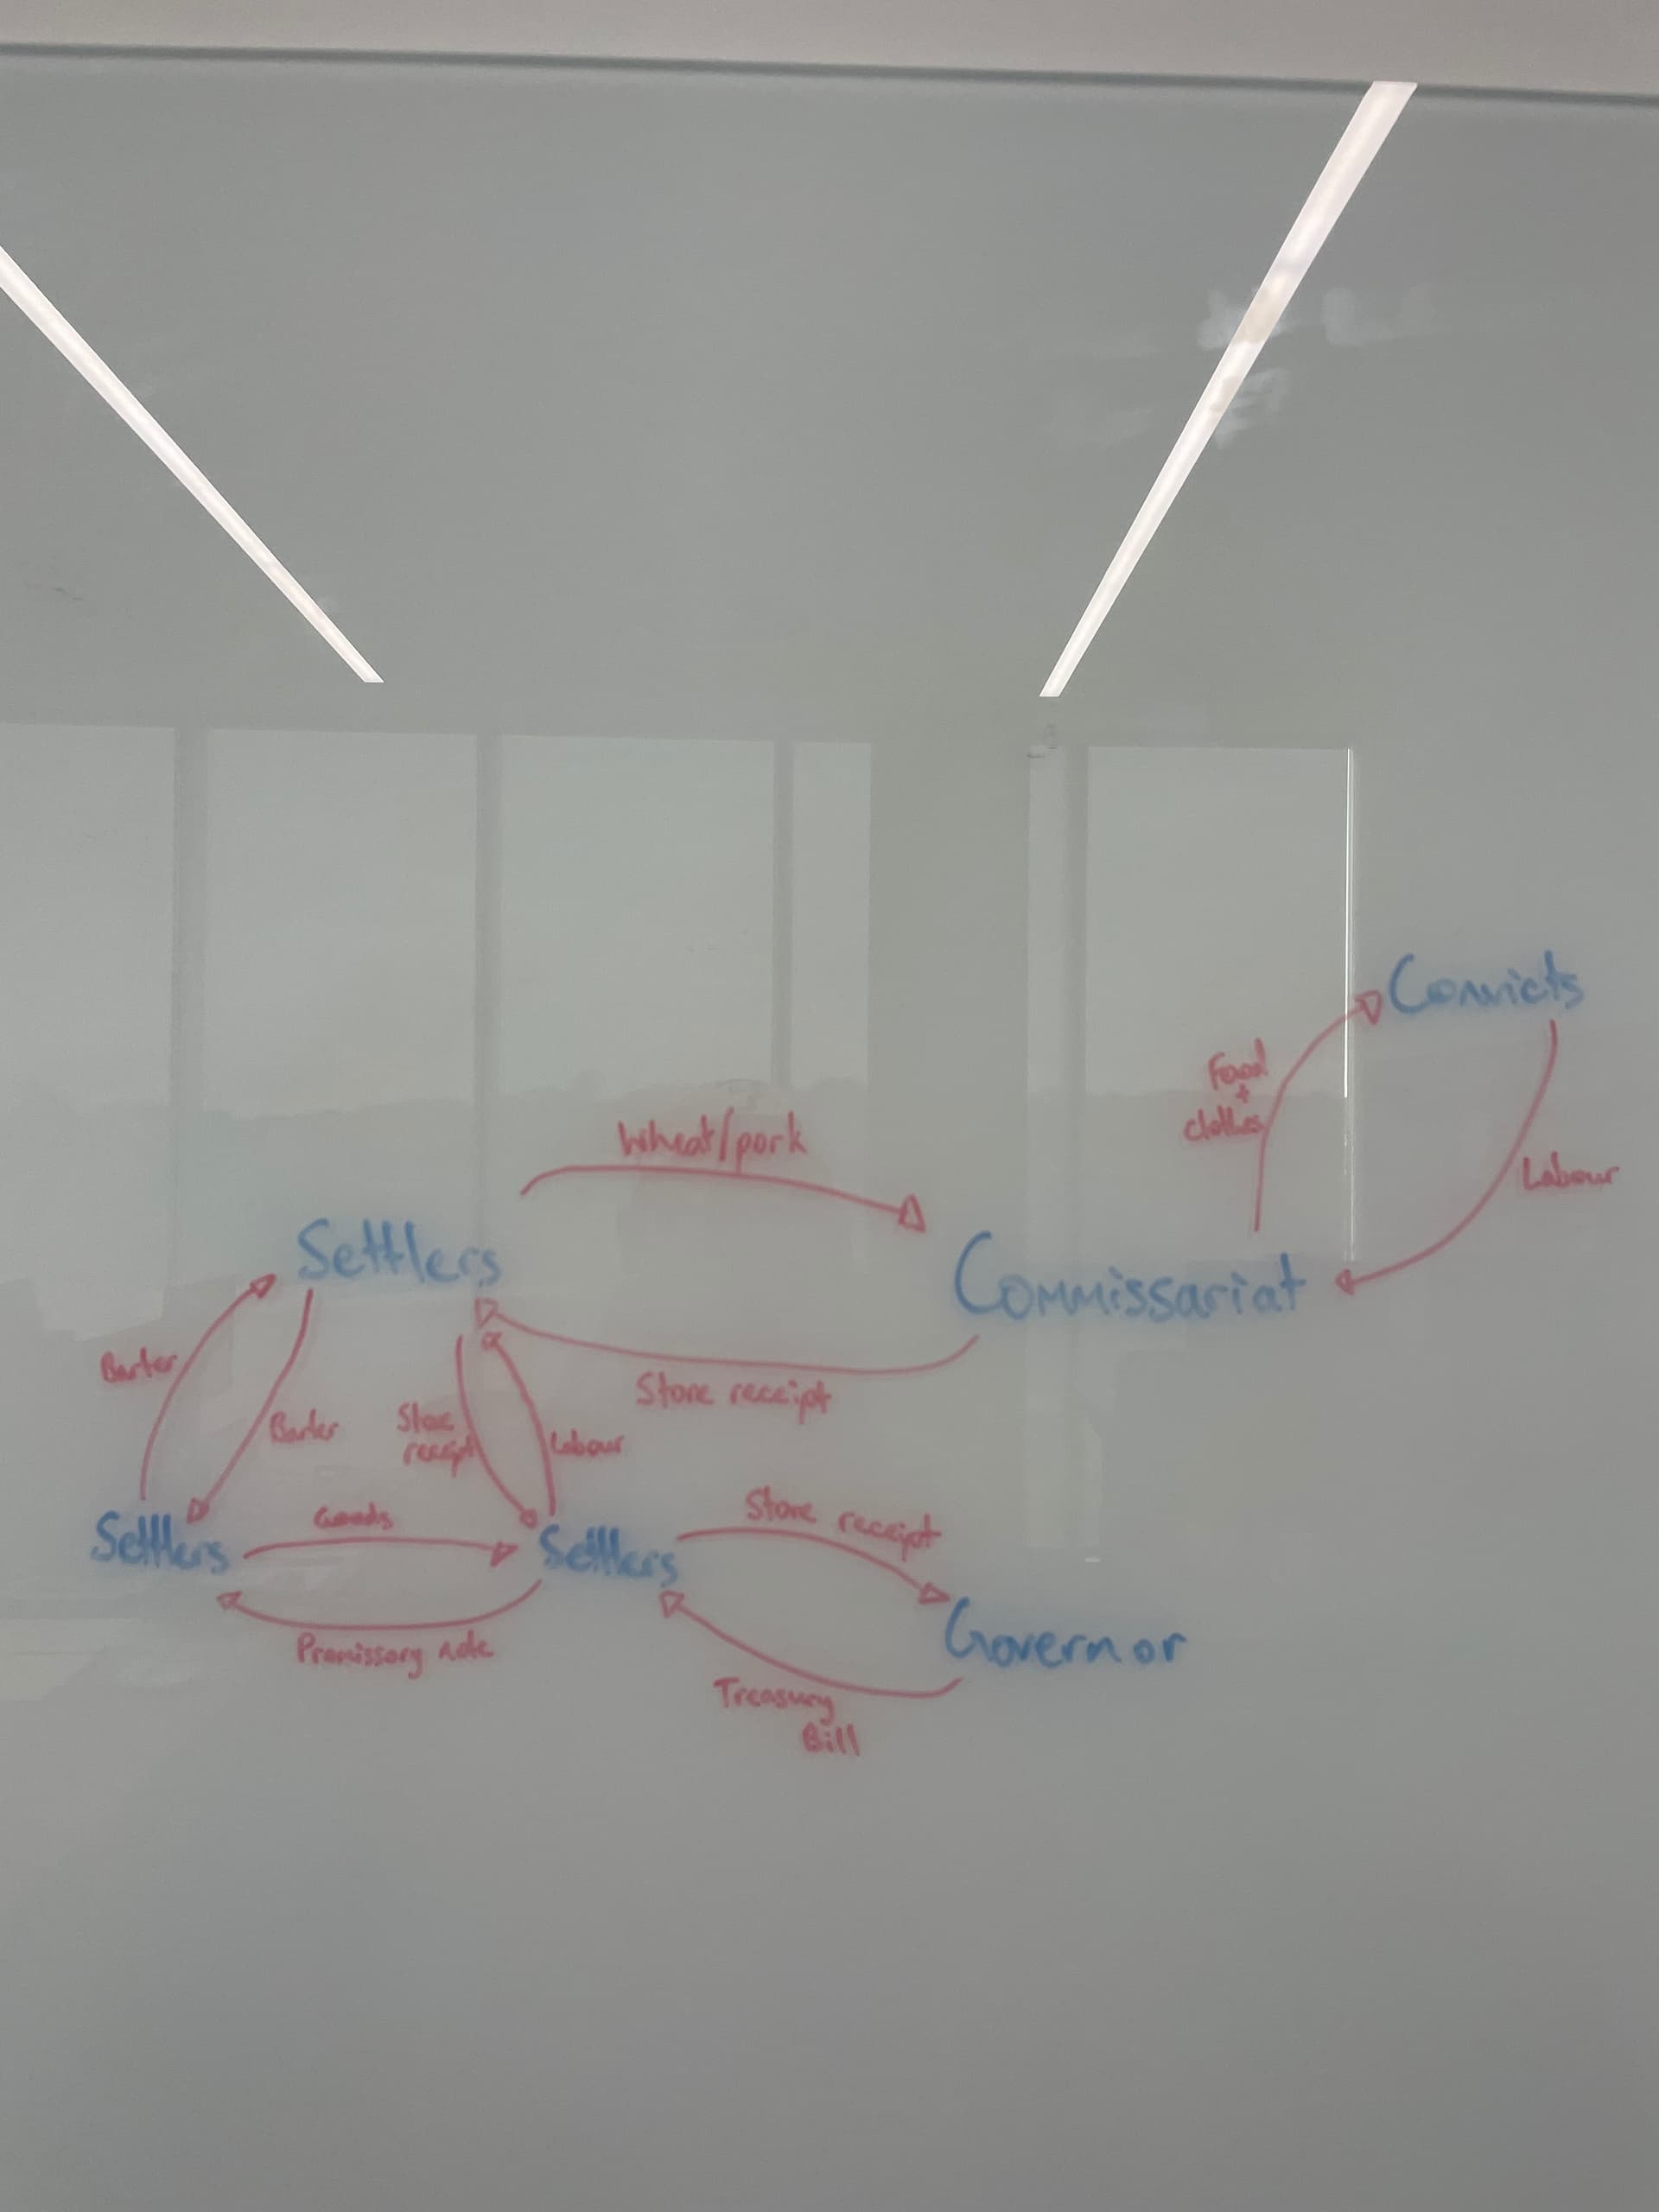
As this is my first post I am restricted to attach one image, otherwise I would have posted a series of iterations of my map. The map starts off with just the ‘Settlers’, the ‘Commissariat’ and the ‘Convicts’. My plan is to build up the map from here (the attached picture captures a quarter of the entire map). But rather than doing this on Powerpoint, I am hoping there is a software that will allow me to add new variables and descriptions of different flows without having to change all of my formatting as I would on Powerpoint.
Many thanks